

Tutorial
Illustrated user guide
| Download as PDF |
|---|
| guide.pdf |
miRNA-centric view
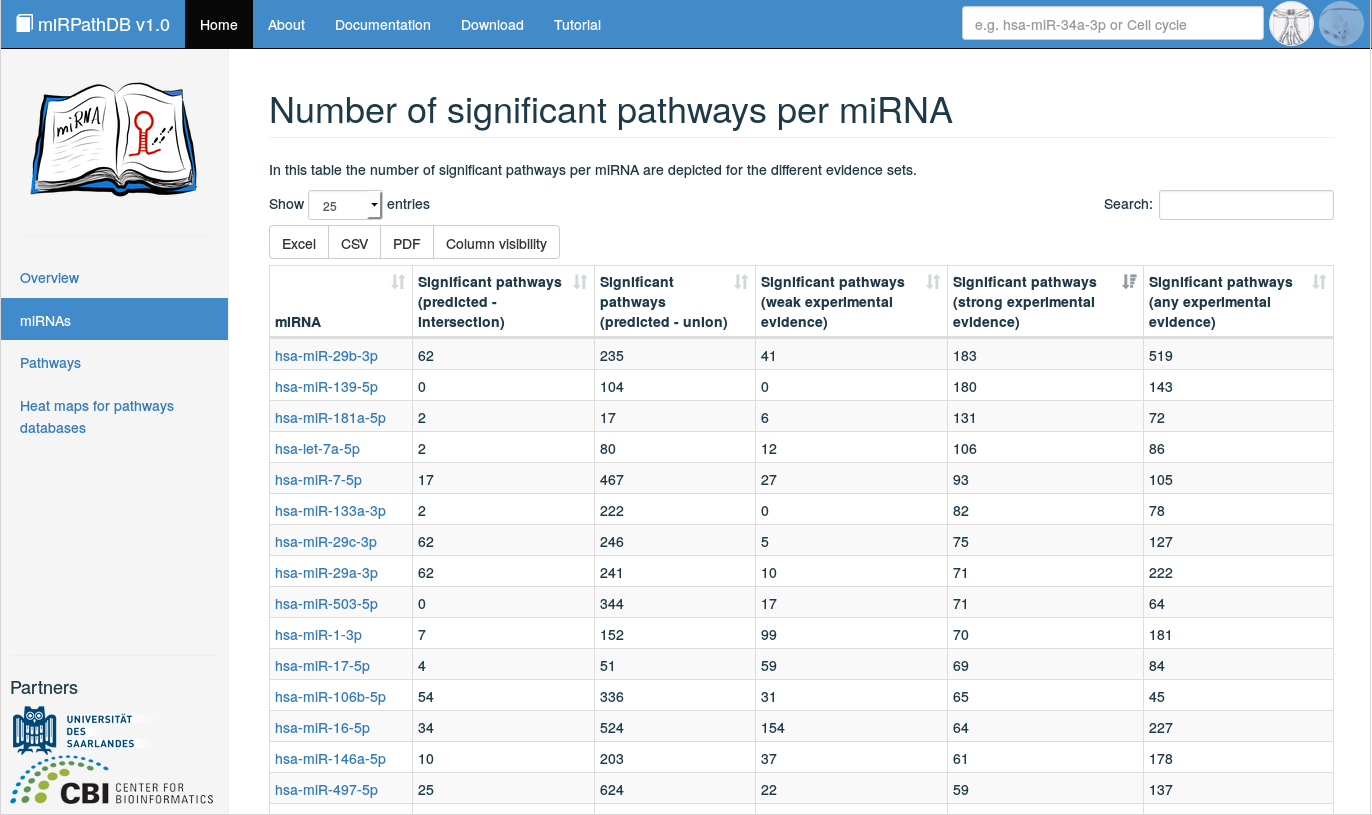
Clicking on miRNAs on the start page or in the side panel yields an overview of all miRNAs that are significantly over-represented in at least one pathway, split into the five categories of miRNA-target interaction sets (any experimental evidence, weak experimental evidence, strong experimental evidence, intersection of predicted target sets, union of predicted target sets). Per miRNA and target set category, the number of significantly enriched pathways is listed. The displayed table is fully searchable and sortable. The number of displayed entries per page can be adjusted, as well as the number of shown columns (button Column visibility). Also, the (filtered) table content can be downloaded in various file formats (.xlsx, .csv, and .pdf) for further processing. Additional information on a miRNA of interest can be obtained by clicking on the miRNA in the table, which forwards the user to a detailed view on this miRNA.
Detailed view: miRNA
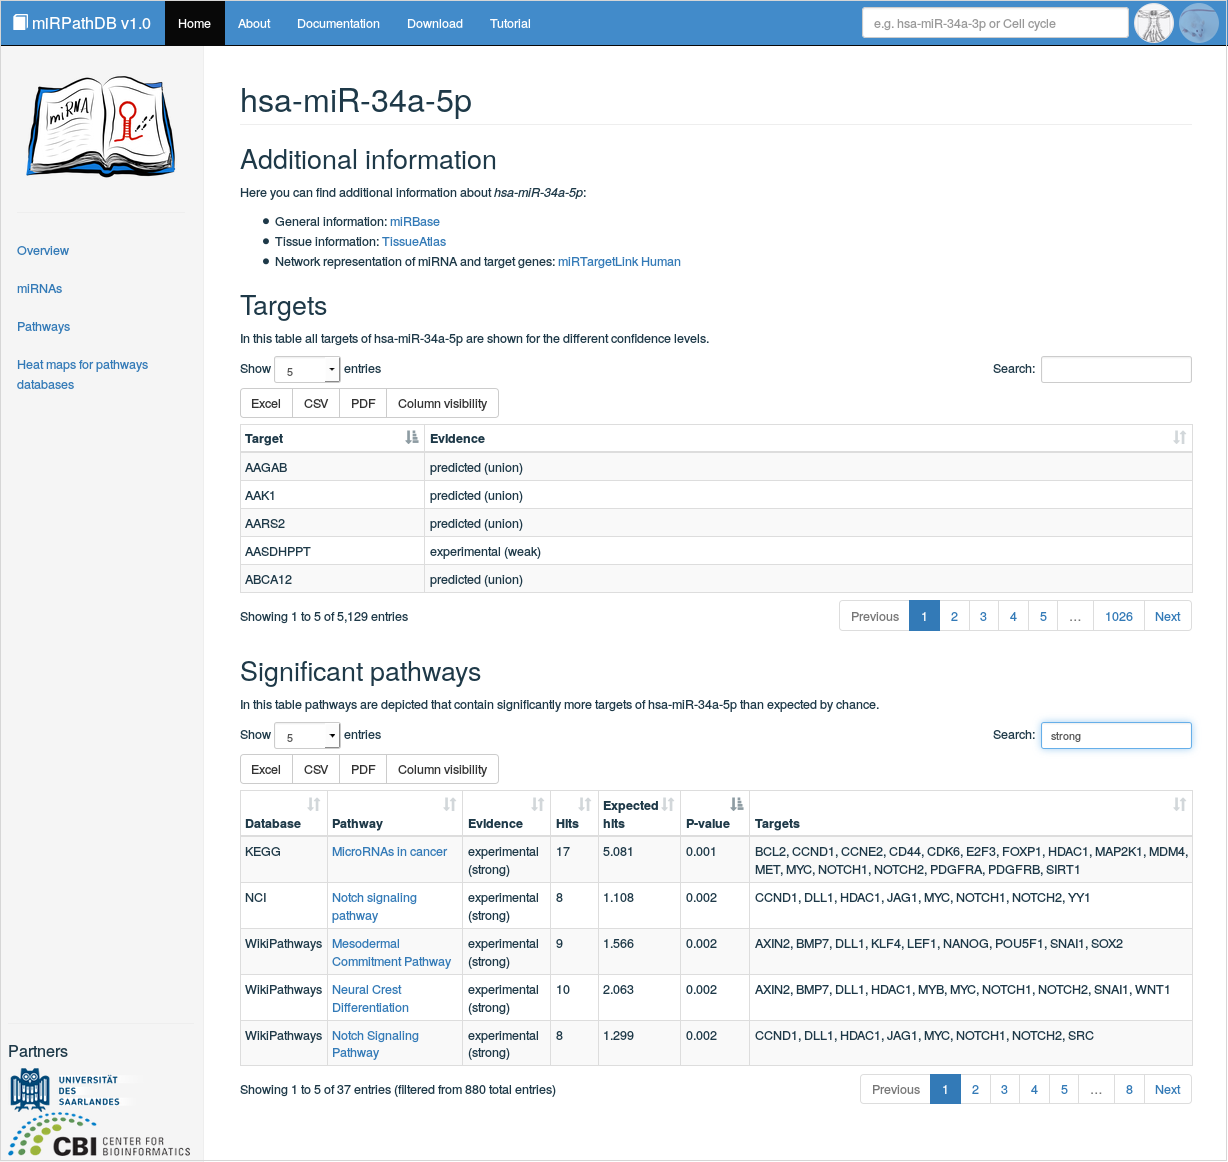
In this view, detailed information on a specific miRNA can be found. It can be reached (i) by clicking on a miRNA of interest in the miRNA-centric table view or (ii) by directly querying the database for a specific miRNA via the global search field. Here, links to external databases for the considered miRNA are provided, with respect to general information (miRBase [1]), tissue specificity (TissueAtlas [2]), and target genes in network representation (MiRTargetLink Human [3]). Also, all validated and predicted targets of the miRNA under investigation are listed with their corresponding target set categories. Finally, a table containing all significantly over-represented pathways are listed, i.e.\ all pathways that contain significantly more targets of the considered miRNA than expected by chance. This table contains information on the database, a certain pathway was obtained from, the evidence level used to map the miRNA to the pathway genes, the considered target genes and the number of hits (mappable genes in category) and expected hits (expected number of hits by chance). This then results in a p-value that assesses the significance of over-representation for this category. Also, the pathways are linked to their pathway-centric view.
Pathway-centric view
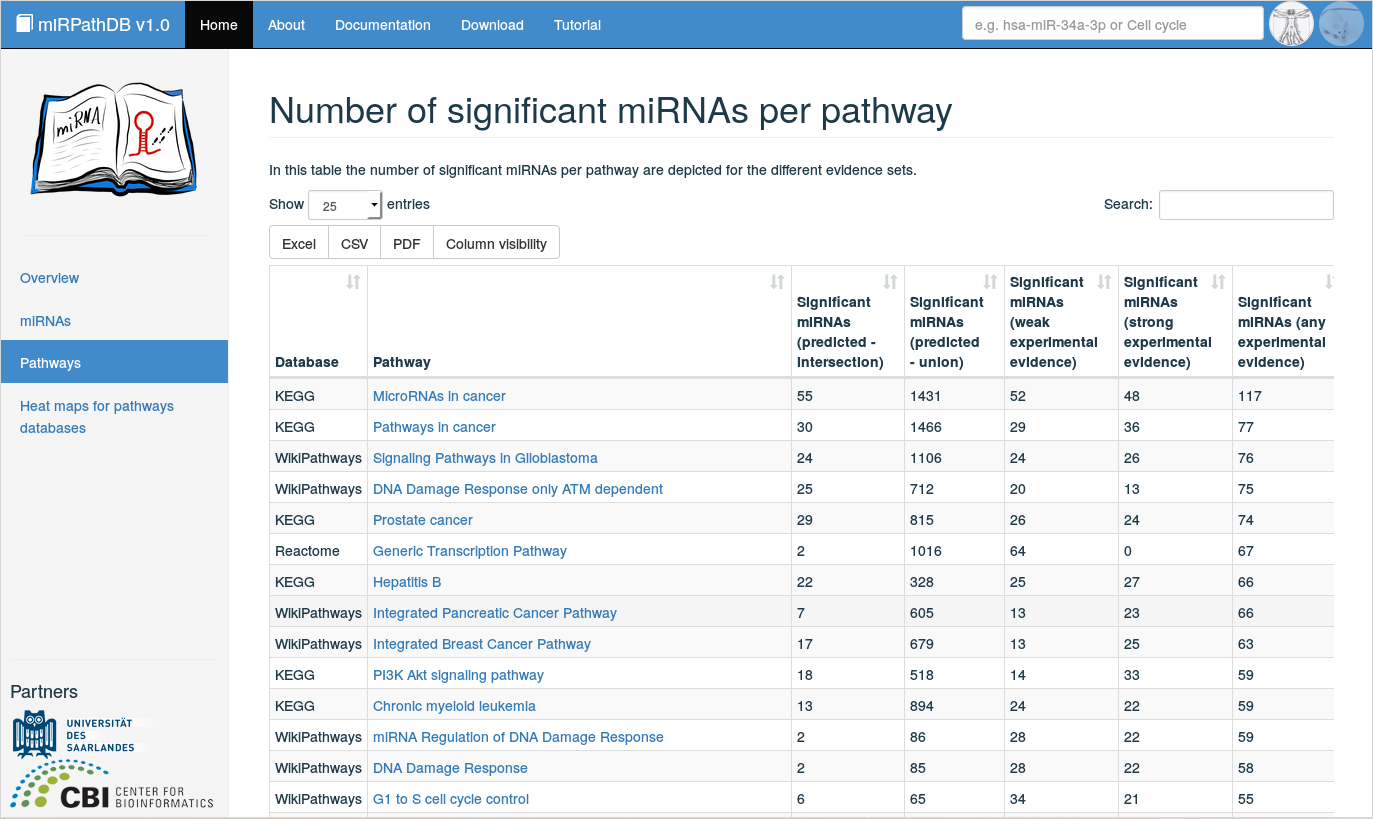
Clicking on Pathways on the start page or in the side panel yields an overview of all pathways that are significantly over-represented for at least one miRNA, split into the five categories of miRNA-target interaction sets (any experimental evidence), weak experimental evidence, strong experimental evidence, intersection of predicted target sets, union of predicted target sets). Per pathway and target set category, the number of significant miRNAs are listed. The displayed table is fully searchable and sortable. The number of displayed entries per page can be adjusted, as well as the number of shown columns (button Column visibility). Also, the (filtered) table content can be downloaded in various file formats (.xlsx and .pdf) for further processing. Additional information on a pathway of interest can be obtained by clicking on the pathway in the table, which forwards the user to a detailed view on this pathway.
Detailed view: pathway
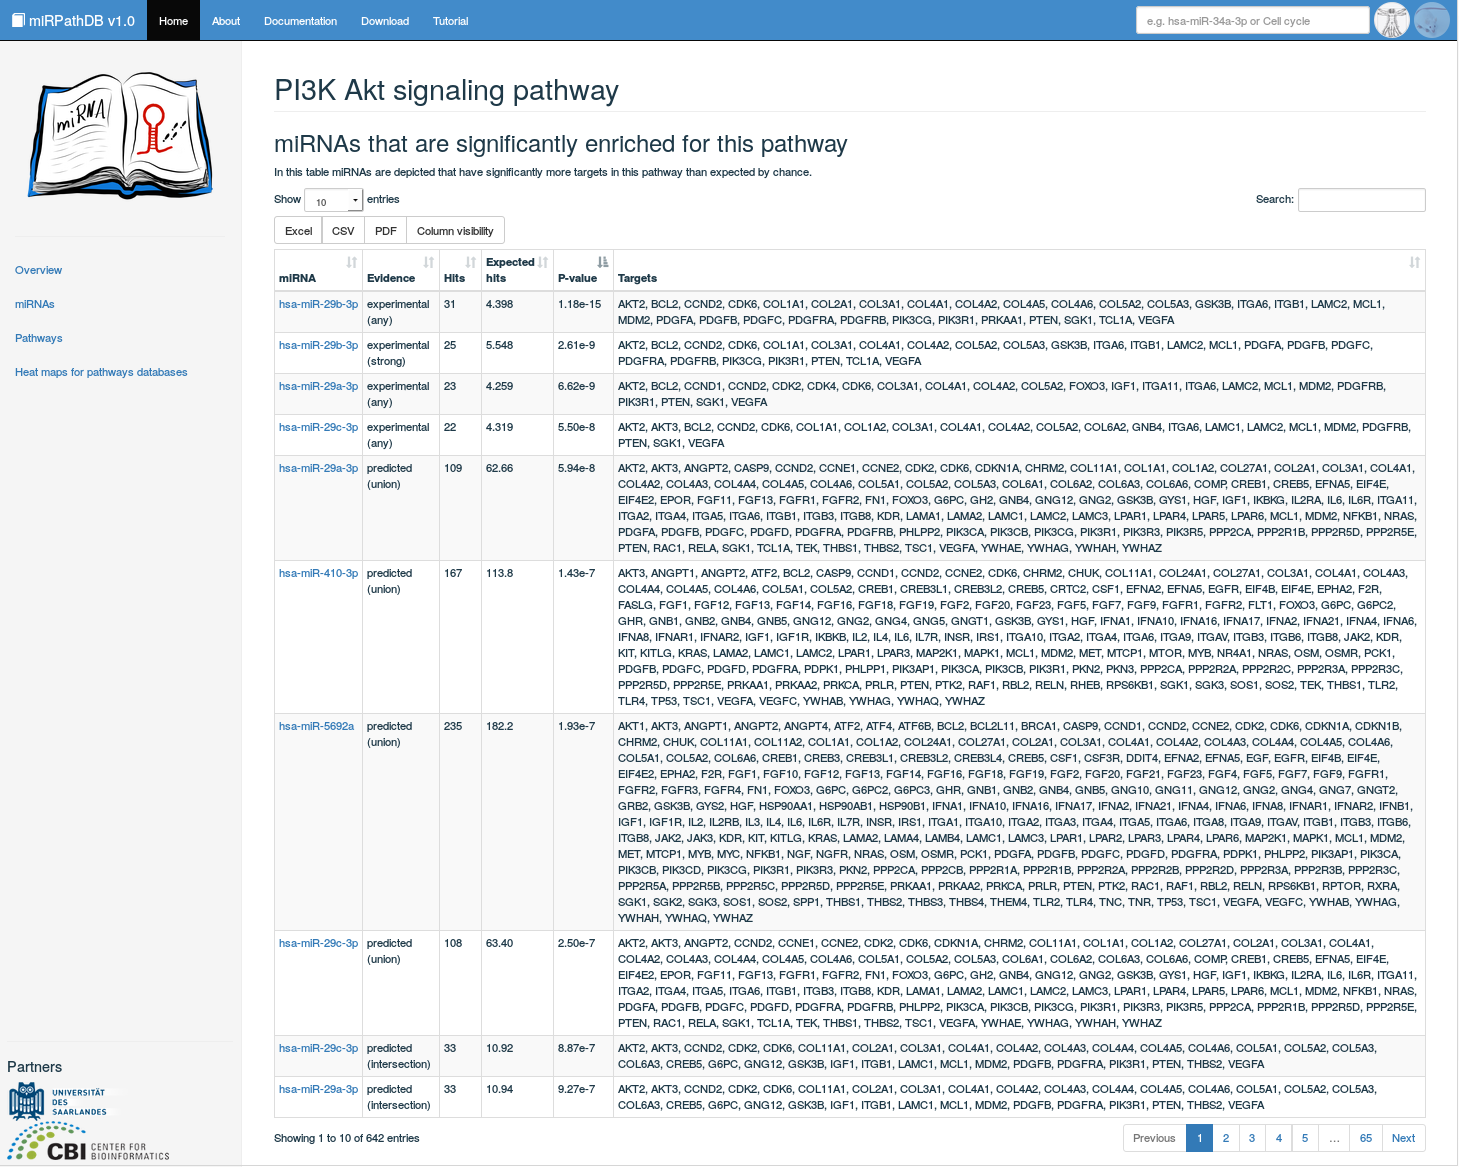
In this view, detailed information on a specific pathway can be found. It can be reached (i) by clicking on a pathway of interest in the pathway-centric table view or (ii) by directly querying the database for a specific pathway via the global search field. Here, a table containing all significant miRNAs targeting the considered pathway are listed, i.e. all miRNAs that have significantly more targets in this pathway than expected by chance. This table contains information on the targeting miRNA and its target genes based on a certain target set category. Also the number of hits (mappable genes in category) and expected hits (exprected number of this by chance) are listed. These then result in a p-value that assesses the significance of over-representation for this miRNA and the considered pathway. Also, the miRNAs are linked to their miRNA-centric view.
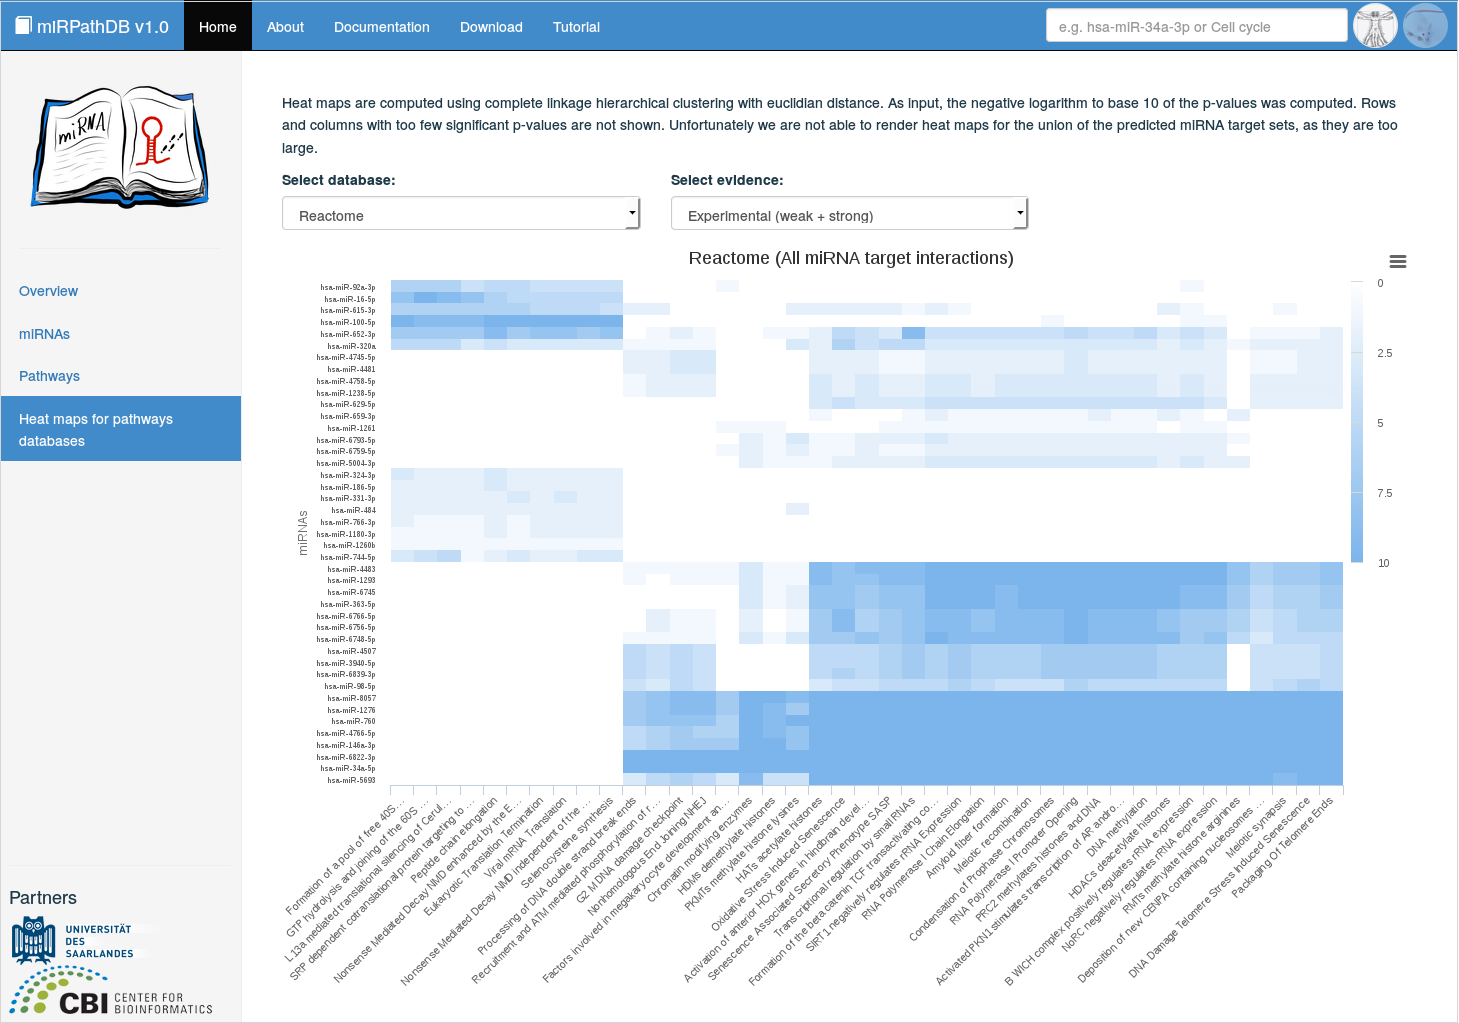
Heatmaps for pathway databases
Clicking on Heat maps for pathway databases on the start page or in the side panel yields an interactive heat map displaying scores of enrichment for a selected set of miRNAs and pathways originating from a specified database. The considered database and confidence level for the mRNA-target interactions, can be selected from drop-down menus. The displayed enrichment scores are computed from the respective p-values as
$$ \text{Enrichment score (category, miRNA, confidence)} = - \log_{10}{(\text{p-value(category, miRNA, confidence}))} $$Hence, the larger the enrichment score (and the 'bluer' the cell), the more significant is the enrichment of the respective miRNA in the respective pathway. Hovering over the cells of the heat map indicates the corresponding miRNAs and pathways withr their respective score. The heat maps are clustered using the hclust method from the stats.
Using this representation, the user can immediately see whether miRNAs targeting pathways are rather specific or whether a miRNA is targeting almost all categories. In the latter case the significant results may e.g. be the result of a bias in the enrichment analysis.
Bibliography
- miRBase - annotating high confidence microRNAs using deep sequencing data Nucleic acids research Oxford Univ Press
- Distribution of miRNA expression across human tissues Nucleic acids research Oxford Univ Press
- miRTargetLink - miRNAs, Genes and Interaction Networks International journal of molecular sciences Multidisciplinary Digital Publishing Institute